How to use Charts object? 
Autor: Adam M.
Visitado 1153,
Seguidores 2,
Compartilhado 0
How to use Charts object?
I recently purchaed the Charts objects. It is not clear how to use it. I created an Excel (CSV) file but the Charts object is not displaying any data on the chart. Are there instructions or better examples?
Publicado em

Since I didn't buy the paid "Charts object" myself, I can't offer any help.
Apart from the screenshot in the marketplace, there are probably no instructions.
>> https://market.websitex5.com/de/objekte/3ac5ed2c-3898-42c2-93c3-16d6508c875
Incomedia employees probably won't be online again until office hours in Italy on Monday.
Maybe users of the charts object will still get in touch.
Hello Adam
With my demo you have better solutions
https://wsx5demo.afsoftware.fr/chart1.html
Axel
Free, very clear and easy-to-use online tool for various diagrams
>> https://graphmaker.imageonline.co/donutchart.php
No CSV files are used here, rather the data is entered by hand and the generated diagrams are offered as images for download.
----- German -----
Kostenloses, sehr übersichtliches und leicht zu bediendes Online-Tool für verschiedene Diagramme
>> https://graphmaker.imageonline.co/barchart-de.php (Nur Diagrammauswahl in deutsch)
Hier werden keine CSV-Dateien genutzt, sondern die Daten werden von Hand eingegeben und das erzeugte Diagramme wird als Bilder zum Download angeboten.
----- Screenshot -----
Different types of charts.
(DE) Verschiedene Arten von Diagrammen.
----- Screenshots -----
Hello Adam,

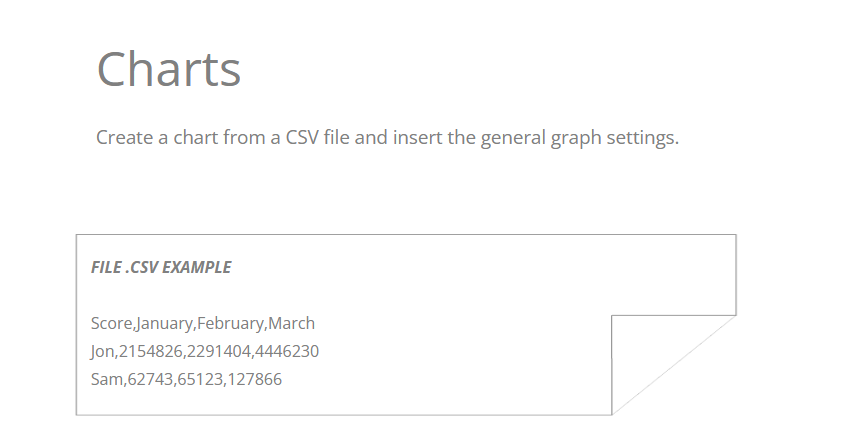
in the Preview section of the object (https://market.websitex5.com/it/oggetti/anteprima/3ac5ed2c-3898-42c2-93c3-16d6508c875?_gl=1*qpd4fr*_up*MQ..*_ga*MTEyMDA2Nzg3Ny4xNzEwNzUxOTY1*_ga_0255SXLXBJ*MTcxMDc1MTk2NC4xLjAuMTcxMDc1MTk2NC4wLjAuMA)
there is an example of how the .csv file should be formatted,
with commas instead semicolon.
When saving from Excel into .csv, open the .csv file with the notepad for example, and you might notice that the data is separated by semicolons.
With CTRL + H you can replace them all with commas, like this:
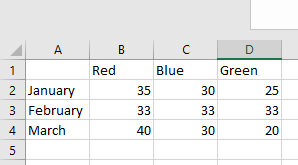
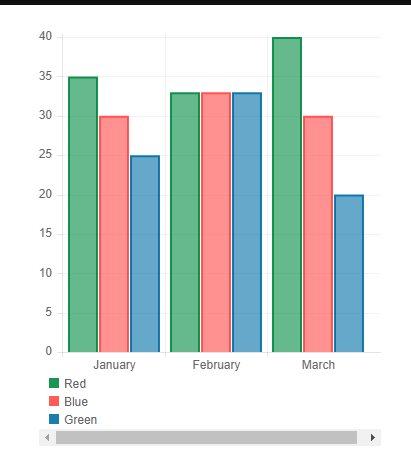
The graph should then be displayed, here is an example (with the initial Excel file as well)


Eric